Wednesday, November 6, 2013

GBPAUD CHFJPY EURCAD Price Action Setup, Nov 5th 2013

 The Chart above is that of CHFJPY daily. It brokeout bullishly on the 22nd of October but failed to push through. The "failed break" as many may call it still keeps the pair within its bullish bias until at least, the support zone as indicated above is clearly broken. In the meantime, bullish entries will be sort from that zone as price possibly makes a failed bearish push within it.

 EURCAD Chart as seen just above shows a pair clearly in a bullish mood. The last bullish break on the 22nd October pushed the pair into a 12months high, with the pair haven gained about 2000 pips from its low dating back to August 2012. This bullishness has intermittently witnessed corrective sell-offs like we are having at the moment but bullish entries will still be sort as the pair delves into our mapped out support zones. The chart above shows from about what region the bulls could get back in.

GBPAUD as shown in its chart above has had its momentum changed from bullish to bearish. Though at the moment, the pair does seem to be setting up for more bulls, it still needs to respect the bearish break it gave off as Ive indicated in its chart. However, pullbacks into the resistance zones as labelled on the chart has to occur for any reasonable sell entries triggering.


Take advantage of my promotional 50% price Slash to enroll for my Price Action Course or a Subscription to my Trade Room or Mentor Programme  to experience the simplicity of trading Price Action with me.

Sunday, November 3, 2013

The week ahead. Nov3-Nov 8, 2013

The chart above reflects the weekly expectation and trend on the eurusd. The trend is clearly bullish after we got a weekly bullish break  as indicated on the chart. Price did continue to bull immediately after the break but the trend has now stalled as we now witness a corrective bearish move and as price drops into our support zone, bullish setups would be sort still on the weekly chart.


 The chart above is the daily chart of the NZDJPY. There was a bullish break on the 22nd of October which failed to push through. Though this break still affords us to remain with a bullish bias on the pair, we have patiently waited for a corrective selloff which has culminated in the Pin bar Trade Setup spotted on the chart on the 29th October. Bullish entries were subsequently made and the bulls are expected to return to the market on this pair.


USDCAD Daily chart above has a bearish undertone. The Pivot Top Reversal Pattern as indicated on the chart should send the bears back into the market.


Take advantage of my promotional 50% price Slash to enroll for my Price Action Course or a Subscription to my Trade Room or Mentor Programme  to experience the simplicity of trading Price Action with me.

Sunday, October 6, 2013

The Week Ahead 7 - 11 Oct., 2013: EURNZD EURJPY EURUSD Price Action Trade Setups

 EURNZD gave off an inside Pin Bar after price has looked to have sliced through Support at about 1.6300. That Price Action Pattern lead the way to some pullback. But when managed to break and close above the previously broken Support to the upside yet again, the bias tilted from expecting more bears to expectation of a new round of bulls. Expectations are for price to reach towards 1.6800 Psychological resistance.

 EURJPY should continue moving southwards following the double daily Pin bars it gave off last week. Reaching support at about the 130.00 Psychological Support remains feasible.

EURUSD gave off a Pivot Top price Action Trade Setup. This setup gives us a bearish bias going into the new week however, further confirmation would be sort on the 4hr time frame before any new sell entries can be made.

Take advantage of my promotional 50% price Slash to enroll for my Price Action Course or a Subscription to my Trade Room or Mentor Programme  to experience the simplicity of trading Price Action with me.

Wednesday, October 2, 2013

USDCAD Price Action: Closing Price Reversal gets further bullish confirmation

The beauty of trading Price Action in the way that I do is that you don't let emotions get in the way, you simply trade what the charts say and in-line with that, the USDCAD's Price Action points to the expectation of further bullishness. Traders do get a little confused and try to chase the market with every formed Price reversal-like Patterns but there is always an over-riding Price pattern. The Closing Price Reversal as indicated above is the over-riding Price Action Pattern in this chart and remains valid for more bulls unless its low is bridged.

Take advantage of my promotional 50% price Slash to enroll for my Price Action Course or a Subscription to my Trade Room or Mentor Programme  to experience the simplicity of trading Price Action with me. 

Monday, September 30, 2013

GBPCHF PRICE ACTION: Bullish Rejection Pin Bars get bearish Confirmation

The previously extensive bullish run on the GBPCHF came to halt after price hit the 1.4800 Psychological resistance. Price subsequently sold off and even managed to put through the sell-off into and below it critical demand zone (1.4600). So far after that, price has remained constrained: trapped within a concession of inside bars. The bias however has changed from bullish to bearish and price is expected to break lower through this present consolidation.

Take advantage of my promotional 50% price Slash to enroll for my Price Action Course or a Subscription to my Trade Room or Mentor Programme  to experience the simplicity of trading Price Action with me. 

Sunday, September 29, 2013

Price Action Trade Setups: The Week Ahead: 30 September - 4 October 2013

The chart above is the Daily Price Action representation of the EURJPY showing the possibility of price heading southwards following the initial Inside Bar Price Action Trade Setup as well as its subsequent bearish confirmation candle which came up as price reacted bearishly after the doji (indecision) candle of the previous day. Price is therefore expected to drop into the bearish targets shown above.


 AUDUSD closed the week with a bearish confirmation candle after the initial bullish run had stalled at about the 0.9500 Psychological Resistance zone. An Inside Bar Trade Setup had triggered the initial sell-off which lead up to the point of formation of a Doji (Indecision) candle on Thursday. However, Friday saw more bearish action which could lead the pair further down into the zones depicted in its chart above.


 AUDCAD Price Action as shown above gives out a clear indication of further bearish expectation on the pair, after a Pin Bar on thursday initiated a minor sell-off on the pair.


NZDCHF started its bearish run with a Pin Bar Price Action Trade Setup. A failed bullish attempt after Thursday's Inside Bar Bullish price Action gives further confirmation of more bears to come. The basic and Extreme targets are as shown in its chart above.


Take advantage of my promotional 50% price Slash to enroll for my Price Action Course or a Subscription to my Trade Room or Mentor Programme  to experience the simplicity of trading Price Action with me. 

Saturday, September 28, 2013

Price Action Trade Setups: Weekly Market Recap September 23 - September 27, 2013


We started this weeks Trade Setup with the posting of the Bullish Closing Price Reversal Trade Setup of the USDJPY (shown again above). The trade is still moving towards the projected Zone as shown in the 2nd figure above.


This trade has so far moved up to about 300pips from the Trade rooms entry though, its currently on about 200pips, the trade remains open and is expected to reach the projected zone as shown above. I posted the initial trade setup of this move on the 25th September.


EURCAD (above) was also one of the pairs which had its trade setup posted within the week and price has also continued to moved long in the anticipated direction from the Trade Setup as posted September 25.


GBPAUD was one of those easy setups in many respect. Apart from the 123 bottom and the Pin Bar Trade Setup, We eventually also had a bullish confirmation Pin bar. This Setup is expected to deliver a minimum of 250pips but ideally, the trade room would aim for about 500pips from it.


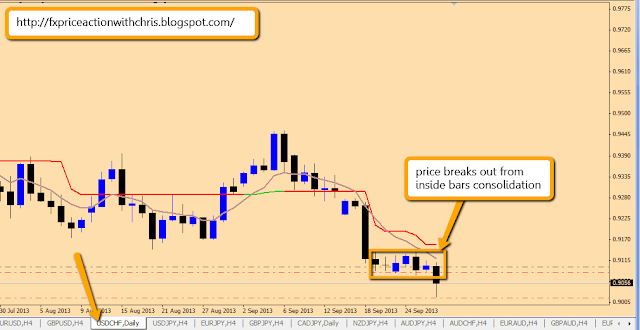
I brought our attention to the Inside Bars consolidation of the USDCHF on 27th September, informing my blog followers and readers of an impending bearish breakout. Now we have had the breakout, with the Trade room taking about 40pips from the initial move. We still have 50% of our trade open on this trade with a trailing of 40pips triggering.


 Most Price Action traders had gone long based on the bullish engulfing bar from the close of trading on Friday 26th September but unfortunately, their stops would have been hit as price continued southwards following the Trade Setup explanations I offered in my Trade commentary on the 27th September.


Take advantage of my promotional 50% price Slash to enroll for my Price Action Course or a Subscription to my Trade Room or Mentor Programme  to experience the simplicity of trading Price Action with me.