Showing posts with label NZDCAD. Show all posts

Saturday, February 8, 2014

Markets Price Action and Trade Setups: THE WEEK AHEAD FEB 10 - 14 2014. NZDCAD GBPUSD GBPCHF EURJPY EURAUD AUDNZD

AUDNZD failed to break above a recent resistance zone, giving off a Pin bar in the wake of the false break. This set the tone for a possible sell off and we mapped out the possible entry points. The pair offered three setups within the 4hr time frame to go with the short and we managed to take them all. 

EURAUD false break of its inside bar set the stage for a possible bullish move. The bullish entry has managed to contain the pair and give further credence to the setup. Entry has been made and hopefully, this setup would offer us a good reward. The take profit zone is also mapped here.

The last time we ran a commentary on this pair (EURJPY) we brough our attention to its head and shoulder formation which we expected to send the pair back into support zone. That scenario played out quite significantly and we now have had a reversal as buyers came in hard at this zone. Price shud continue long in the coming week

 GBPCHF also has has given off a nice looking Pin Bar at support and the bullish zone has offered us a chance to join in on the expected bullishness. A 1-2 R/R should easily be met with this setup.


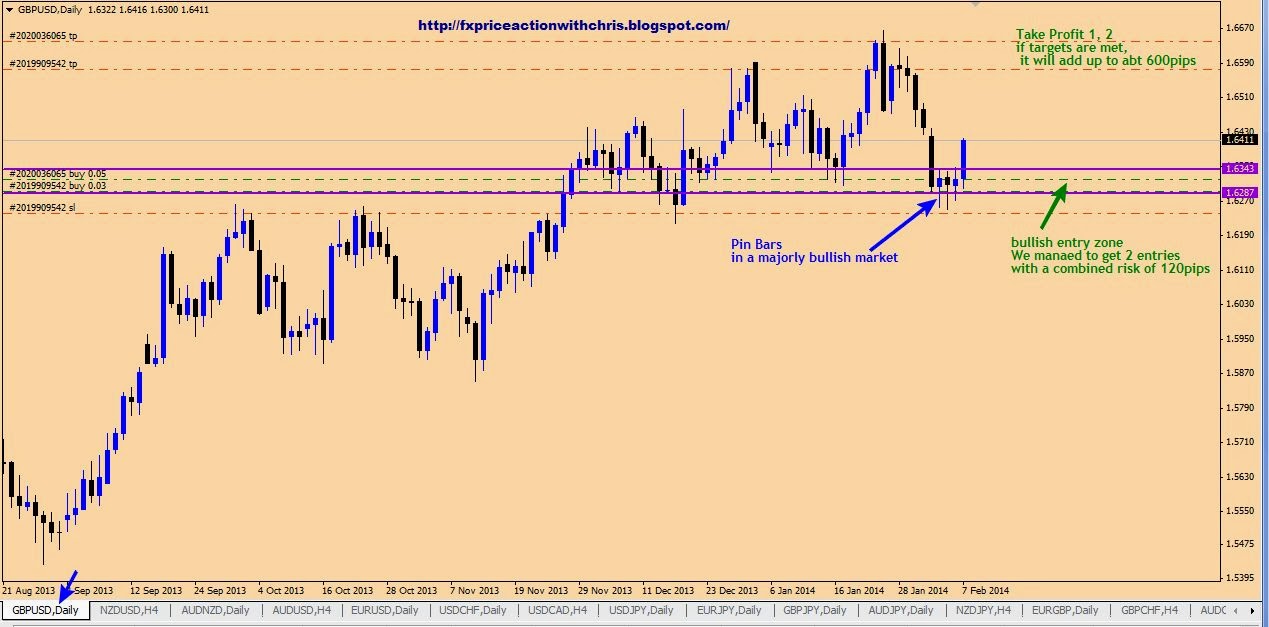
 GBPUSD offered quite a number of oppurtunities for long entries after we got a sinificant Pin Bar at the false break of the support. We managed to place 2 entries and both are already on a 1-2 R/R.

NZDCAD looks like a pair on a mission and we are on board with it. After the formation of the engulfing bar, we mapped out our possible entry zones and were able to make just one entry from this setup.


Take advantage of my promotional 50% price Slash to enroll for my Price Action Course or a free Subscription to my Trade Room or Mentor Programme  to experience the simplicity of trading Price Action with me.


Free Signal Service:
Fee: $0
Duration: for life
send me an email for detail on this
ahizechris@gmail.com
or skype :christian.ahize

Sunday, November 24, 2013

Markets Price Action, The week ahead. AUDJPY AUDUSD CADCHF GBPAUD GBPCHF GBPUSD NZDCAD NZDCHF

AUDJPY chart above shows us a likely continuation of the bullish trend that emered after price hit a double bottom at about 5 and 27th August 2013. Its always safer to go with the major trend. If we get a reasonable setup on this pair in the coming week, we would buy into the pair. The pair currently trades just above a Support.

 AUDUSD has given off a bearish break changing our bias on the pair. We had expected the pair to bull from the Previous support but it has failed to push the pair significantly higher. A corrective bullish pullback is expected still before any new bearish entries can be made.

 CADCHF is clearly a bearish market with new entries made each time it swings. The current move on this pair could yet break the recent lows.

 GBPAUD has failed to resume a new bearish trend as had been expected. But good enough, there was no Trade setup to warrant any bearish entry and with break of the previous high, the bullish trend resumes. but like before, we still shall wait for price to sell corrective into our mapped support zones.

 GBPCHF has closed with a fakey Price action trade Setup after the initial rejection of the higher prices at its key resistance zone. The trade made new bearish entries on this setup and we look to the pair falling into the first mapped support zone. New bullish entries could also be made at those points.

 GBPUSD looks to be trapped within a horizontal consolidation. sell entries will be made as it faces rejection at the resistance zone while buy entries made at the support.

 NZDCAD also looks to be trapped withing a horizontal consolidation. A buy entry could be taken if the dynamics are right.

NZDCHF is very close to the Trade Room's take profit, which also is the support zone for the bullish break. We could take a buy entry if the price action is right.

Wednesday, September 4, 2013

Trade Call: Buying NZDCAD Based on break of psychological resistance Update


The Trade Call from yesterday on the NZDCAD has pulled higher significantly though its yet to hit  our expected TP level, the trade is well over 80pips green at the moment. If our target is reached, the trade will close out on about 180pips. The trade initially drew some concerns from a few of my students in the Mentor group based on the candle close formation after the breakout candle, which seemed like a bullish rejection but the break was still in play and it is normal that a minor retracement follows a valid breakout.

Take advantage of my promotional 50% price Slash to enroll for my Price Action Course or a Subscription to my Trade Room or Mentor Programme  to experience the simplicity of trading Price Action with me. 


Tuesday, September 3, 2013

Trade Call: Buying NZDCAD Based on break of psychological resistance


This is an example of how I make entries as shown here in the buy Trade Call (buy Limit NZDCAD at 0.8205 SL 0.8107 TP 0.8393) posted to members of my Trade Room. Our expectation is for price to make an attempt to reach 0.8400 psychological resistance zone. This trade was made based on the bullish break noticed on the 4 hour time frame, also evident in the 123 bottom break on the daily time frame after the formation of a Pin bar on August 28.

Take advantage of my promotional 50% price Slash to enroll for my Price Action Course or a Subscription to my Trade Room or Mentor Programme  to experience the simplicity of trading Price Action with me.